
An Overview
Across the United States, we use historical rainfall data to predict rainfall intensity and flood risk. To do so, accurate information on rainfall amounts is essential. The National Oceanic and Atmospheric Administration (NOAA) is the agency of the United States federal government responsible for providing data and forecasts for weather and water cycle events.
History of Rainfall Data
The initial national rainfall data analysis began in 1935, evaluating data obtained from only 200 Weather Bureau stations. Starting in 1955, the Weather Bureau coordinated their efforts with the Soil Conservation Service and published Technical Paper 40 (TP-40) in 1961. NOAA published two additional documents supplementing TP-40, TP-49 in 1964 and Hydro-35 in 1977.
TP-40 is still widely used and includes maps for various storms where the user can estimate rainfall depths from the isopluvial lines. Recognizing the data used in developing TP-40 was collected prior to 1961 and had limited spatial coverage, NOAA, with funding from various sources, began data analysis for Atlas 14.
What is Atlas 14?
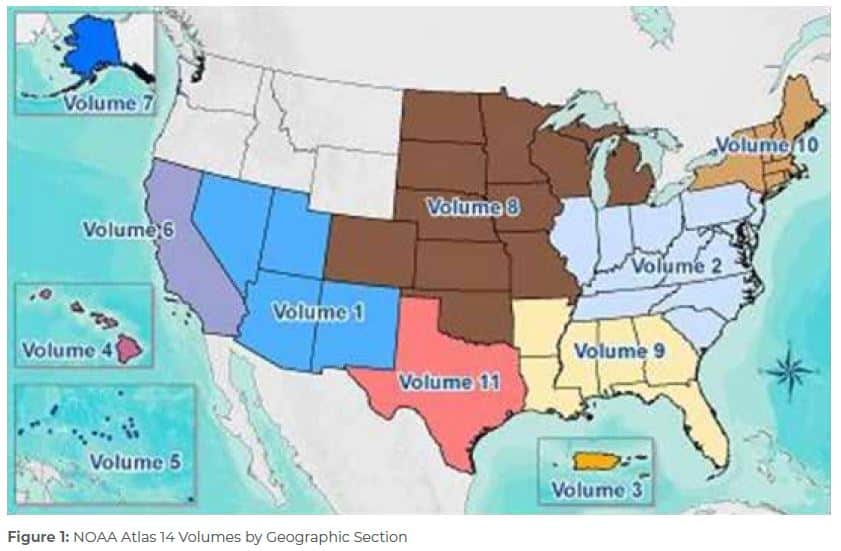
NOAA’s Atlas 14 is an ongoing study used to analyze historical rainfall data and predict the likelihood of a rainfall event in any given year. The study contains the latest rainfall data and has been completed across most of the United States, with different volumes based on geographic region of the country (see Figure 1). However, there are five remaining northwestern states that rely upon NOAA’s older Atlas 2 rainfall data, as no funding is available to update estimates for NOAA Atlas 14 coverage.
How are precipitation estimates developed?
The Hydrometeorological Design Studies Center’s (HDSC) team of scientists, mathematicians, statisticians, and meteorologists analyze precipitation volume data to help us prepare for major storm events. Precipitation volume data is based on rainfall intensity, duration and frequency estimates from historical data collected from observing stations across each geographic region. The Atlas 14 rainfall data can be obtained at https://hdsc.nws.noaa.gov/hdsc/pfds/.
Need for Atlas 14
Here are three examples supporting the development of Atlas 14:
Atlas 14, Volume 8 – Midwest
The states within the Midwest Region have historically used TP-40 (1961), TP-49 (1964) and Hydro-35 (1977). In 1992, NOAA released a publication called Rainfall Frequency Atlas of the Midwest, more commonly known as Bulletin 71, which served as an updated source for rainfall frequency. Each of these reports focus on different rain event durations and return periods. In 2013, NOAA completed Atlas 14, Volume 8, giving the midwest states once source of data covering rain event durations ranging from five minutes to 60 days with return periods between two years through 1,000 years. Using NOAA Atlas 14 data, storm event definitions in Southeast Michigan have increased by 1 to 2 inches for various design storms.
Atlas 14, Volume 10 – North East
The states within the North East Region have historically used TP-40 (1961), TP-49 (1964 and Hydro-35 (1977). Thirty years later, following the completion of the NERCC Extreme
Precipitation analysis in 2010, states within the region had a fourth data source. Each of these reports focus on different rain event durations and return periods. In 2015, NOAA completed Atlas 14, Volume 10, giving the Northeastern states one source of data covering rain event durations ranging from five minutes to 60 days with return periods between two years through 1,000 years. Much of Massachusetts has seen a 1- to 2- inch increase in the 24-hr/100-year storm.
Atlas 14 volume 11 – Texas
Texas has historically used TP-40 (1961), TP-49 (1964) and Hydro-35 (1977). The United States Geological Service (USGS) and Texas Department of Transportation (TXDOT) developed depth duration frequency data which was published in 1998 and updated in 2004. In 2018, NOAA completed Atlas 14, Volume 11, giving Texas one source of data covering rain event durations ranging from five minutes to 60 days with return periods between two years through 1,000 years. The central and coastal regions of Texas have shown an increase in occurrence and intensity of major storm events: Austin area realizing 2- to 2 1/2- inch increase in the 24-hr/100-year storm; Houston area realizing 3- to 5- inch increase in the 24hr/100-year storm.
How does Atlas 14 affect me?
Atlas 14 provides improved storm predictions that will allow for appropriate adjustments to stormwater management systems. Using NOAA’s Atlas 14 for the management of stormwater will allow municipalities and designers across the US to make the appropriate adjustments needed to increase the useful life of infrastructure and protect communities and water resources from unnecessary risk.